Received: Sat 15, Aug 2020
Accepted: Mon 31, Aug 2020
Abstract
To investigate the synergistic effects of periodontal disease and diabetes mellitus on atherosclerosis, we evaluated the monocyte chemoattractant protein-1 (MCP-1) expression of endothelial cells induced by Porphyromonas gingivalis-lipopolysaccharide (LPS) and high glucose. We also tested whether antioxidants could inhibit the MCP-1 expression induced by the simultaneous stimulation of LPS and high glucose. Human umbilical vein endothelial cells (HUVECs) were stimulated with various concentrations of P. gingivalis-LPS (0.1, 1.0, and 10 µg/mL) in normal glucose (5.5 mM), with high glucose (10 mM and 20 mM), and with 0.1 µg/mL P. gingivalis-LPS in high glucose. MCP-1 expressions were measured by real-time RT-PCR and ELISA. Vitamin C (100 µM) and vitamin E (50 µM) were administered before simultaneous stimulation with 0.1 µg/mL P. gingivalis-LPS and 20 mM glucose. LPS ≥ 1.0 μg/mL increased the expression of MCP-1 mRNA and protein compared to unstimulated HUVECs. High glucose in the culture medium increased the MCP-1 mRNA expression slightly but significantly at 2 hr of incubation, but the MCP-1 protein level was not increased. Simultaneous stimulation with 0.1 μg/mL LPS and high glucose increased the expression of MCP-1 mRNA and protein compared to unstimulated HUVECs. By contrast, pre-incubation of vitamin C or E inhibited the increase of MCP-1 mRNA expression induced by 0.1 μg/mL LPS and 20 mM glucose. Our finding that high glucose enhanced the MCP-1 expression with even a low level of LPS suggests that caution is advisable regarding the atherogenicity of diabetic patients with periodontal disease.
1. Introduction
Atherosclerosis is a chronic inflammatory disease of the arteries that is characterized by the activation of endothelial cells, the recruitment of monocytes into the vessel wall, and the differentiation of recruited macrophages into cholesterol-laden foam cells [1]. Monocyte chemoattractant protein-1 (MCP-1) is a chemokine that is considered a key player in monocyte recruitment into the arterial wall, which is thought to be an essential step in the development and progression of atherosclerosis [2]. We demonstrated that low-density lipoprotein (LDL) obtained from diabetic patients was oxidized and enhanced the expression of MCP-1 mRNA in human umbilical vein endothelial cells (HUVECs), and we thus speculated that the LDL of diabetic patients accelerates their atherosclerosis [3].
Porphyromonas gingivalis-derived lipopolysaccharide (LPS) upregulates the expression of adhesion molecules, growth factors, and MCP-1 in arterial wall cells [4]. In addition, high glucose induces monocyte-endothelial cells' adhesion and transmigration by increasing the expressions of MCP-1 and vascular cell adhesion protein 1 (VCAM-1) in human aortic endothelial cells [5]. However, synergetic effects of LPS and high glucose on MCP-1 expression in HUVECs have not yet been investigated, to the best of our knowledge. We have, therefore, investigated whether a high glucose concentration in a culture medium enhances the P. gingivalis-LPS induced MCP-1 expression in HUVECs compared to a normal glucose concentration in the culture medium.
In atherosclerosis, oxidative stress has been implicated as an important etiologic factor and in vascular function [6]. Antioxidants such as vitamin C and E may thus inhibit atherogenesis and improve vascular function by decreasing the cellular production and the release of reactive oxygen species (ROS) and inhibiting endothelial activation (i.e., expression of adhesion molecules and monocyte chemoattractants) [6]. In the present study, therefore, we used vitamins C and E to test whether they could suppress the expression of MCP-1 induced by P. gingivalis-LPS and high glucose.
2. Materials and Methods
2.1. Cell Culture
HUVECs were harvested from umbilical cord veins and cultured in M199 medium supplemented with 10% fetal calf serum (FCS; Invitrogen, Carlsbad, CA), 20 µg/mL endothelial cell growth supplement (Sigma-Aldrich, St. Louis, MO), 100 µg/mL heparin (Sigma-Aldrich), and 5 μL/mL penicillin-streptomycin liquid (Sigma-Aldrich). This cell culture medium contains a concentration of 5.5 mM glucose. Cells were used within six passages.
2.2. Measurement of MCP-1 mRNA Expression by Real-Time Reverse Transcriptase-Polymerase Chain Reaction Analysis
The expressions of MCP-1 mRNA in HUVECs were measured by a real-time reverse transcriptase-polymerase chain reaction (real-time RT-PCR). For the quantitation of MCP-1 mRNA expression induced by LPS, HUVECs were grown to confluence in 35-mm gelatin-coated dishes in the cell culture medium. The cell culture medium was replaced with a new 0.5 mL of the cell culture medium and LPS at 0.1, 1.0, and 10 µg/mL was added. After each incubation time of 1, 2, 4, 6, and 12 hr with LPS, total RNA was extracted using TRIzol (Invitrogen), and a real-time RT-PCR for MCP-1 mRNA was performed with the same primers used in our previous study [7]. The standard curve of MCP-1 mRNA was composed by using the total RNA of the unstimulated HUVECs, and the expression of MCP-1 mRNA is given relative to that in the unstimulated HUVECs.
To examine the MCP-1 mRNA expression induced by high glucose, 2.3 µL or 7.3 µL of 1 M glucose was added to 0.5 mL of the cell culture medium for the concentration of 10 mM glucose or 20 mM glucose, respectively, and HUVECs were incubated for 1, 2, 4, 6, and 12 hr. Then, total RNA was extracted, and a real-time RT-PCR for MCP-1 mRNA was performed. In the case of simultaneous stimulation with LPS and high glucose, 0.1 µg/mL LPS plus 10 mM glucose or 20 mM glucose as final concentrations were added together to 0.5 mL of cell culture medium and HUVECs were incubated for 2, 4, 6, and 12 hr. The total RNA was then extracted, and a real-time RT-PCR for MCP-1 mRNA was performed.
To examine the inhibitory effect of vitamin C or E on the enhancement of MCP-1 mRNA expression induced by 0.1 µg/mL LPS and 20 mM glucose, 1 hr before the administration of 0.1 µg/mL LPS+20 mM glucose, 100 µM vitamin C or 50 µM vitamin E was added to 0.5 mL of the cell culture medium. After 2-hr stimulation by 0.1µg/mL LPS+20 mM glucose with or without Vitamin C or E, total RNA was extracted, and real-time RT-PCR analyses of MCP-1 mRNA were performed. In addition, to test the suppressive effect of vitamin E against 0.1 µg/mL LPS+20 mM glucose, we conducted the same experiment using a 24-hr pre-incubation with 50 µM vitamin E in place of the 1-hr pre-incubation time.
2.3. Measurement of MCP-1 Protein Expression in the Cell Culture Medium by Enzyme-Linked Immunosorbent Assay
The concentrations of MCP-1 protein in the cell culture medium produced by HUVECs were measured by enzyme-linked immunosorbent assay (ELISA) using the MCP-1 ELISA kit (R&D Systems, Minneapolis, MN). For the quantitation of MCP-1 protein expression induced by LPS, HUVECs were grown to confluence in 96-well gelatin-coated dishes in the cell culture medium. The cell culture medium was replaced with new 0.5 mL of the cell culture medium, and LPS at 0.1, 1.0, or 10 µg/mL was added. After incubation times of 2, 6, 12, and 24 hr with LPS, supernatants were extracted, and the measurement of the concentrations of MCP-1 protein was performed according to the manufacturer's instructions.
For the quantitation of MCP-1 protein expression induced by LPS and high glucose, 0.1 µg/mL LPS plus 10 mM glucose or 20 mM glucose were added together to 0.5 mL of cell culture medium in the 96-well gelatin-coated dishes, then incubated for 2, 4, 6, or 12 hr. We then measured the concentrations of MCP-1 protein in the supernatants. The concentrations of MCP-1 protein were divided by that of unstimulated HUVECs and are given relative to that in the unstimulated HUVECs.
2.4. Statistical Analysis
All data are presented as the mean ± SEM. The statistical analysis was performed by a one-way analysis of variance (ANOVA) followed by Fisher post-hoc tests for comparisons of multiple groups. Results were considered significant when the p-value was <0.05.
3. Results
3.1. Expression of MCP-1 mRNA Induced by LPS
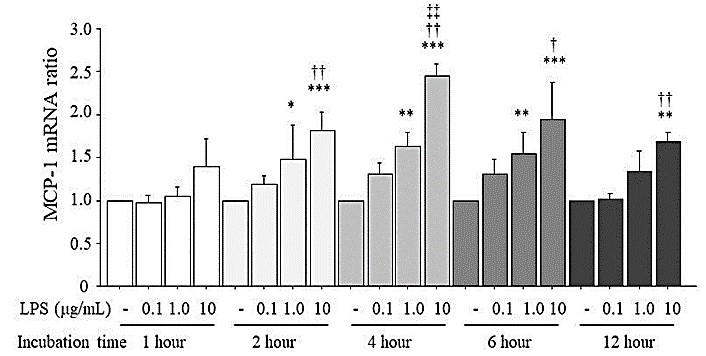
Figure 1 shows the expression of MCP-1 mRNA induced by LPS in HUVECs. HUVECs were stimulated by LPS at 0.1, 1.0, and 10 μg/mL and incubated for 1, 2, 4, 6, or 12 hr under a normal glucose concentration (5.5 mM) in the culture medium. LPS over the concentration of 1.0 μg/mL increased the MCP-1 mRNA expression dose-dependently at the 2-, 4-, and 6-hr incubation times. At 12 hr of incubation, only 10 μg/mL LPS increased the MCP-1 mRNA expression compared to that of the unstimulated HUVECs.
3.2. Expression of MCP-1 Protein Induced by LPS
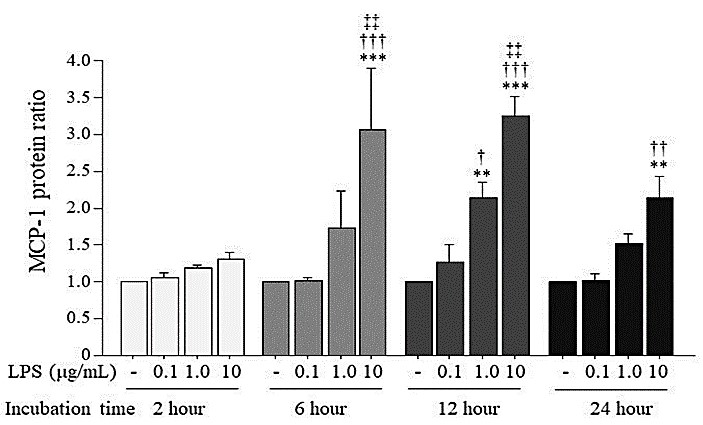
Figure 2 shows the ratio of MCP-1 protein concentration in the medium induced by LPS in HUVECs. HUVECs were stimulated by LPS at varying doses (0.1, 1.0, 10 μg/mL) and incubation times (2, 6, 12, 24 hr) under a normal glucose concentration (5.5 mM) in the culture medium. At the 6-hr and 12-hr incubation times, 10 μg/mL LPS increased the MCP-1 protein to approximately threefold higher than that of the unstimulated HUVECs, and at the 12-hr incubation, 1.0 μg/mL LPS also increased the MCP-1 protein to 2.2-fold higher than that of the unstimulated HUVECs.
3.3. Expression of MCP-1 mRNA and Protein Induced by High Glucose
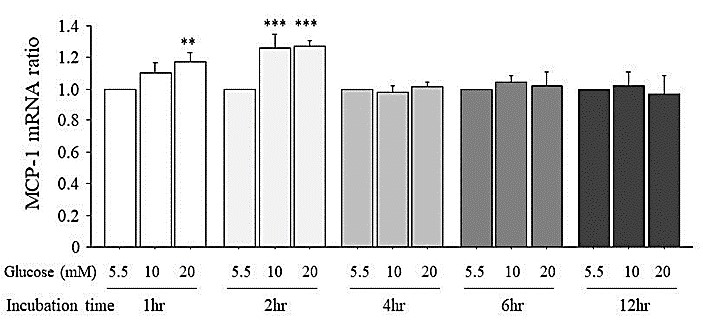
Figure 3 shows the expression of MCP-1 mRNA produced by HUVECs cultured in normal glucose (5.5 mM) or high glucose (10 mM or 20 mM). At the 1-hr incubation, 20 mM glucose in the culture medium and at the 2-hr incubation, both 10 mM and 20 mM glucose in the culture medium increased the MCP-1 mRNA expression slightly but significantly. From 4-hr incubation to 12 hr incubation, no increase in the MCP-1 mRNA expression by high glucose was seen.
Regarding the production of MCP-1 protein, from 2- to 24-hr incubation, there was no increase of the MCP-1 protein in the medium by high glucose, and the levels of MCP-1 protein in the medium were equal to those observed with 5.5 mM glucose (data not shown).
3.4. Enhancing Effects of High Glucose on the MCP-1 mRNA Expression Induced by LPS
To investigate the effects of high glucose on LPS-induced MCP-1 mRNA expression in HUVECs, we employed the LPS concentration of 0.1 μg/mL, which did not increase the MCP-1 mRNA expression at any incubation time. As shown in (Figure 4), at the 2-, 4-, 6-, and 12-hr incubations, 0.1 μg/mL LPS did not increase the MCP-1 mRNA expression compared to that of the unstimulated HUVECs, but high glucose at 10 mM and 20 mM added to 0.1 μg/mL LPS increased the MCP-1 mRNA expression compared to that of the unstimulated HUVECs.
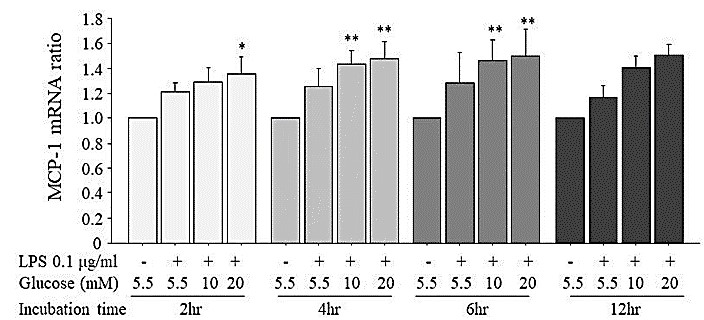
At the 2-hr incubation, 0.1 μg/mL LPS+20 mM glucose increased the MCP-1 mRNA expression to 1.36-fold that of the unstimulated HUVECs, and at 4 hr and 6 hr of incubation, 0.1 μg/mL LPS+10 mM or 20 mM glucose increased the MCP-1 mRNA expression compared to that of the unstimulated HUVECs, but the expressions of MCP-1 mRNA in 0.1 μg/mL LPS+10 mM or 20 mM glucose were not significantly different from those in 0.1 μg/mL LPS+5.5 mM glucose. At 12 hr of incubation, the MCP-1 mRNA expression induced by LPS 0.1 μg/mL+10 mM or 20 mM glucose tended to be increased compared to that of the unstimulated HUVECs, but the difference was not significant.
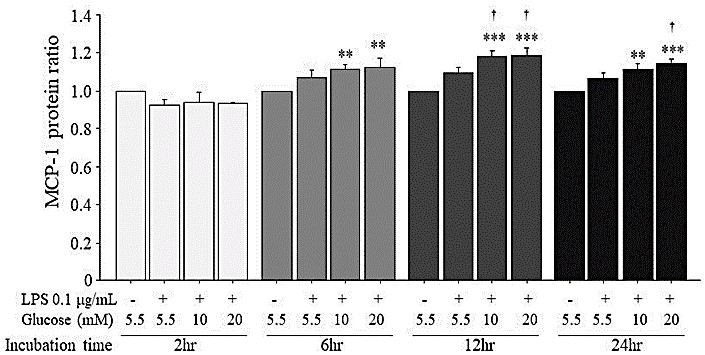
3.5. Enhancing Effects of High Glucose on MCP-1 Protein Expression Induced by LPS
As in the case of MCP-1 mRNA expression (Figure 4), high glucose (10 mM and 20 mM) added to 0.1 μg/mL LPS increased the MCP-1 protein production compared to that of the unstimulated HUVECs (Figure 5). In particular, at 12-hr incubation, the MCP-1 protein expression induced by 0.1 μg/mL LPS+10 mM or 20 mM glucose was higher than that induced by 0.1 μg/mL LPS+5.5 mM glucose and at 24-hr incubation, the MCP-1 protein expression induced by 0.1 μg/mL LPS+20 mM glucose was higher than that induced by 0.1 μg/mL LPS+5.5 mM glucose.
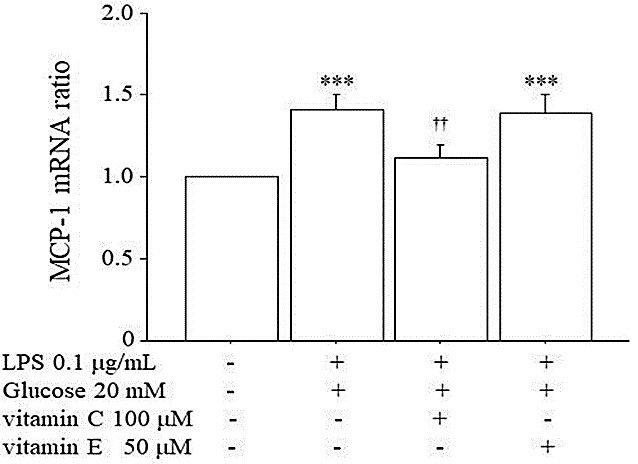
3.6. Inhibitory Effects of Vitamin C and E on the MCP-1 mRNA Expression Induced by High Glucose+LPS
Because vitamins C and E are known as antioxidants, and since they are known to have inhibitory effects on MCP-1 expression, we investigated whether vitamin C or E can suppress the increase of MCP-1 mRNA expression induced by LPS + high glucose. Vitamin C at 100 µM or vitamin E at 50 µM was administered 1 hr before the simultaneous stimulation by 0.1 μg/mL LPS + 20 mM glucose. Figure 6 shows that vitamin C, but not vitamin E, significantly inhibited the increase of MCP-1 mRNA expression induced by 0.1 μg/mL LPS + 20 mM glucose. In the case of 24-hr pre-incubation with vitamin E before the stimulation by LPS + 20 mM glucose, the 50 µM vitamin E significantly suppressed the MCP-1 mRNA expression induced by LPS + 20 mM glucose (LPS + 20 mM glucose: 1.35 ± 0.16 vs. LPS + 20 mM glucose with vitamin E: 1.12 ± 0.03, p=0.0496, n=12).
4. Discussion
In a study using a human macrophage cell line, U937, it was reported that high glucose (25 mM) enhanced the secretion of inflammatory mediators such as interleukin (IL)-6, tumor necrosis factor-alpha (TNF-α) and prostaglandin E2 (PGE2) induced by 0.1, 1.0 or 10 μg/mL of P. gingivalis-LPS, and the study's authors concluded that hyperglycemia compromises the periodontal health of patients with diabetes mellitus [9]. In addition, Iwata et al. demonstrated that in THP-1 monocytes, high glucose upregulated the Escherichia coli-LPS-stimulated production of inflammatory cytokines such as TNF-α and MCP-1 through the activation of c-jun N-terminal kinase (JNK), and the study's authors suggested that these results may be one of the mechanisms by which subclinical infections by Gram-negative bacteria promote atherosclerosis in diabetic subjects [10].
In view of this, our results obtained using endothelial cells (HUVECs) stimulated simultaneously with P. gingivalis-LPS and high glucose are along this line of evidence of synergistic effects of periodontal disease and diabetes mellitus on atherosclerosis, although the detailed mechanisms are unknown except for that of oxidative stress because vitamins C and E suppressed the enhancement of MCP-1 expression induced by simultaneous stimulation with P. gingivalis-LPS and high glucose.
Vitamins C and E are thought to reduce the risk of cardiovascular disease due to their antioxidant effects. Vitamin C at 50–200 μM suppressed the MCP-1 expression induced by lysophosphatidylcholine, an oxidized component of LDL in HUVECs [11] and 20–60 μM vitamin E also suppressed IL-1β-induced MCP-1 production dose-dependently in human aortic endothelial cells (HAECs) [12]. We, therefore, used 100 μM vitamin C and 50 μM vitamin E in the present study. Our results demonstrated that both of these vitamins at those concentrations suppressed the enhancement of MCP-1 mRNA expression induced by the simultaneous stimulation with LPS + high glucose with a 1-hr pre-incubation for vitamin C and 24-hr pre-incubation for vitamin E.
LPS is known to stimulate endothelial cells such as HUVECs through Toll-like receptor 4 complex (which consists of soluble CD14 and MD2), and then NF-κB (which is the transcription factor of MCP-1) is activated through two signaling pathways: the PI3 kinase/Akt pathway and the IκB kinase (IKK) pathway [13]. On the other hand, it was reported that high glucose (25 mM and 35 mM) accelerates MCP-1 production via p38 MAPK in HUVECs with induced Jun N-terminal kinase (JNK) activity [14]. However, this phenomenon was seen after a 7-day incubation. By contrast, regarding short-term high-glucose exposure, Piga et al. reported that in HAECs, 25 mM glucose significantly increased the MCP-1 mRNA expression at a 3-hr incubation, as is the case in the present study [5]. In addition, Piga et al. suggested that the short-term high-glucose exposure induced NF-κB activation via the production of intracellular reactive oxygen species (ROS), as determined using the fluorescence probe DCFH-DA. Therefore, in the case of simultaneous stimulation by LPS and high glucose in HUVECs, we speculate that oxidative stress evoked by high glucose enhanced the LPS-induced MCP-1 expression through additional NF-κB activation; however, we do not yet know the detailed signaling pathway.
Periodontitis is reported to be associated with endothelial dysfunction [15, 16], which is an initial step of atherosclerosis due to the subsequent overexpression of adhesion molecules and chemokines, including MCP-1 [17]. Hence, our present observation that high glucose enhanced the MCP-1 expression stimulated by even a low level of LPS (which alone did not increase the MCP-1 expression) compared with unstimulated HUVECs indicates that the atherogenicity of diabetic patients with periodontal disease should be monitored carefully, although it is not yet known whether diabetic patients with periodontal disease are more likely to be affected by atherogenicity compared to diabetic patients without periodontal disease. On the other hand, although it is reported that the use of an antioxidant with periodontal treatment has the potential to improve periodontal clinical parameters [18], the combination of periodontal therapy with antioxidants for diabetic patients with periodontal disease may be effective against atherogenicity.
5. Conclusion
Our present findings confirmed that high glucose concentrations of culture medium enhanced the MCP-1 expression induced by 0.1 μg/mL of P. gingivalis-derived LPS, a concentration which alone was not great enough to strengthen the expression of MCP-1 mRNA and protein in HUVECs. This means that glucose has a synergistic effect with LPS on the induction of MCP-1 expression in HUVECs, and it indicates that in diabetic patients with periodontal disease, atherosclerosis may be accelerated compared to that of diabetic patients without periodontal disease because MCP-1 has a central role in the formation of atherosclerotic lesions. Our results thus suggest the need to determine whether the simultaneous presence of diabetes mellitus and periodontal disease promotes atherosclerosis synergistically in humans, and if so, how this occurs.
Acknowledgments
This work was supported by a JSPS KAKENHI grant, no. JP25463222. We gratefully acknowledge the superb assistance from Ayaka Tagami, Naoko Sakamuro, Misa Moriyama, Yuka Harano, Mikino Ishimaru, Moyo Honda, Natumi Tokusige, and Haruka Murakami.
Conflicts of Interest
None.
REFERENCES
- Clett Erridge “The roles of Toll-like receptors in atherosclerosis.” J Innate Immun, vol. 1, no. 4, pp. 340-349, 2009. View at: Publisher Site | PubMed
- Vincent Braunersreuther, François Mach, Sabine Steffens “The specific role of chemokines in atherosclerosis.” Thouromb Haemost, vol. 97, no. 5, pp. 714-721, 2007. View at: PubMed
- Kazuo Sonoki, Mototaka Yoshinari, Masanori Iwase, et al. “Glycoxidized low-density lipoprotein enhances monocyte chemoattractant protein-1 mRNA expression in human umbilical vein endothelial cells: relation to lysophosphatidylcholine contents and inhibition by nitric oxide donor.” Metabolism, vol. 51, no. 9, pp. 1135-1142, 2002. View at: Publisher Site | PubMed
- L Kocgozlu, R Elkaim, H Tenenbaum, et al. “Variable cell responses to P. gingivalis lipopolysaccharide.” J Dent Res, vol. 88, no. 8, pp. 741-745, 2009. View at: Publisher Site | PubMed
- Rosaria Piga, Yuji Naito, Satoshi Kokura, et al. “Short-term high glucose exposure induces monocyte-endothelial cells adhesion and transmigration by increasing VCAM-1 and MCP-1 expression in human aortic endothelial cells.” Atherosclerosis, vol. 193, no. 2, pp. 328-334, 2007. View at: Publisher Site | PubMed
- B Frei “On the role of vitamin C and other antioxidants in atherogenesis and vascular dysfunction.” Proc Soc Exp Biol Med, vol. 222, no. 3, pp. 196-204, 1999. View at: Publisher Site | PubMed
- Kazuo Sonoki, Masanori Iwase, Shigehiro Ohdo, et al. “Statin inhibits the expression of secretory phospholipase A2 and subsequent monocyte chemoattractant protein-1 in human endothelial cells.” J Cardiovasc Pharmacol, vol. 64, no. 6, pp. 489-496, 2014. View at: Publisher Site | PubMed
- Shan Ling Hung, Nin Gi Lee, Lien Yu Chang, et al. “Stimulatory effects of glucose and Porphyromonas gingivalis lipopolysaccharide on the secretion of inflammatory mediators from human macrophages.” J Periodontol, vol. 85, no. 1, pp. 140-149, 2014. View at: Publisher Site | PubMed
- Hirotaka Iwata, Yoshihiko Soga, Michio Meguro, et al. “High glucose up-regulates lipopolysaccharide-stimulated inflammatory cytokine production via c-jun N-terminal kinase in the monocytic cell line THP-1.” J Endotoxin Res, vol. 13, no. 4, pp. 227-234, 2007. View at: Publisher Site | PubMed
- Ju Pin Pan, Tsai Mu Cheng, Shiu Chin Chou, et al. “Vitamin C protects against lysophosphatidylcholine-induced expression of monocyte chemoattractant protein-1 in cultured human umbilical vein endothelial cells.” J Formos Med Assoc, vol. 102, no. 3, pp. 151-157, 2003. View at: PubMed
- D Wu, T Koga, K R Martin, et al. “Effect of vitamin E on human aortic endothelial cell production of chemokines and adhesion to monocytes.” Atherosclerosis, vol. 147, no. 2, pp. 297-307, 1999. View at: Publisher Site | PubMed
- Shauna M Dauphinee, Aly Karsan “Lipopolysaccharide signaling in endothelial cells.” Lab Invest, vol. 86, no. 1, pp. 9-22, 2006. View at: Publisher Site | PubMed
- Hiroshi Takaishi, Takahiro Taniguchi, Akihiro Takahashi, et al. “High glucose accelerates MCP-1 production via p38 MAPK in vascular endothelial cells.” Biochem Biophys Res Commun, vol. 305, no. 1, pp. 122-128, 2003. View at: Publisher Site | PubMed
- Salomon Amar, Noyan Gokce, Sonia Morgan, et al. “Periodontal disease is associated with brachial artery endothelial dysfunction and systemic inflammation.” Arterioscler Thouromb Vasc Biol, vol. 23, no. 7, pp. 1245-1249, 2003. View at: Publisher Site | PubMed
- Maurizio S Tonetti, Francesco D'Aiuto, Luigi Nibali, et al. “Treatment of periodontitis and endothelial function.” N Engl J Med, vol. 356, no. 9, pp. 911-920, 2007. View at: Publisher Site | PubMed
- Subodh Verma, Michael R Buchanan, Todd J Anderson “Endothelial function testing as a biomarker of vascular disease.” Circulation, vol. 108, no. 17, pp. 2054-2059, 2003. View at: Publisher Site | PubMed
- Francisco Wilker Mustafa Gomes Muniz, Sergiana Barbosa Nogueira, Francisco Lucas Vasconcelos Mendes, et al. “The impact of antioxidant agents complimentary to periodontal therapy on oxidative stress and periodontal outcomes: A systematic review.” Arch Oral Biol, vol. 60, no. 9, pp. 1203-1214, 2015. View at: Publisher Site | PubMed