Received: Fri 10, Jul 2020
Accepted: Fri 24, Jul 2020
Abstract
Objective: Patients with successfully repaired coarctation of the aorta (CoA) need continued follow-up due to risks of restenosis and abnormal arterial compliance, causing early onset hypertension/coronary artery disease. We hypothesize that subtle hemodynamic and structural abnormalities can be predicted in the clinic by an abnormal arm-leg blood pressure (BP) gradient (i.e. arm > leg systolic BP).
Design: Uncomplicated CoA patients repaired between 1990 and 2007 with follow-up clinic visits documenting right arm and leg systolic BPs, along with a recent echocardiogram, were studied. Data included the Doppler peak instantaneous (PeakV) and mean velocities (MeanV) in the descending aorta along with measures of the proximal transverse arch (TA) diameter and left ventricular wall (LVPWd) thickness. Measurements were indexed by Z-scores. Patients were grouped by higher systolic BP in the leg (Group 1) or arm (Group 2).
Results: Eighty-one patients met the criteria with 52 in Group 1 (median 12.5 years follow-up) and 29 in Group 2 (median 12 years follow-up). Group 2 group had significantly increased arm systolic BP Z-scores (p <0.01), PeakV (p <10-4), MeanV (p <10-6), and LVPWd (p <0.01) compared to Group 1. There was no difference, however, in arm diastolic BP (p =0.7) or TA diameter (p =0.5). These relationships held true even in otherwise “silent” patients without clinical hypertension.
Conclusion: Abnormal arm-leg blood pressure gradients accurately identified CoA patients with elevated arch velocities and increased ventricular wall thickness years after repair. The arm-leg pressure measurements could more accurately select patients in need of further imaging studies and therapeutic interventions.
1. Introduction
Coarctation of the aorta (CoA) is a congenital defect whose consequences, even when adequately repaired, can extend into adolescence and beyond. In early series, up to 75% of repaired patients developed hypertension later in life with a significantly reduced life expectancy (72% survival at 30 years, compared to >90% in a matched population) [1, 2]. Initial data suggested that the hypertension was a consequence of late repairs, so operations in infancy became the norm. However, even with this shift, follow-up continues to show that around 25% of repaired patients develop hypertension by the time of adolescence, often as a result of decreased arterial compliance/ vasculopathy [3-6].
Therefore, despite adequate repair, CoA must be considered a lifelong disease, and routine surveillance is essential. Imaging is performed at least every 5 years to detect an increasing aortic gradient or sequelae of hypertension/afterload (or both) [7]. The most common modality is an echocardiogram, which can readily and noninvasively provide information on structural and flow properties about the arch. Similarly, cardiac MRI is a viable option in older children but can be associated with high costs. However, 5 years in between studies can be an unacceptably long period if clinical signs of increased afterload or arch pathology begin to manifest, and so patients are followed in the clinic in the interim with yearly physical exams [7].
The crux of the physical exam in a CoA patient is the brachial systolic blood pressure (BP), and clinicians often rely on this to track the quality of CoA outcomes and to identify those in need of more detailed evaluation. However, the brachial BP is notoriously inconsistent in identifying patients with vasculopathy [8-10], and reliance on this finding can give a false sense of security. When there are concerns for recoarctation, an arm-to-leg BP gradient is usually checked; otherwise, it is frequently omitted from the physical exam if the child is thought to be doing “clinically well” and with “no concerns.” We find this to be a critical oversight, as the gradient not only suggests restenosis but also can attest to the quality of outcome: that is, the presence of any associated vasculopathy/afterload pathology usually only seen on imaging studies. Surprisingly, the usefulness of an arm-leg BP gradient as measured in the clinic and how it correlates with echocardiographic findings has not been well described in scientific reports or in textbooks of pediatric cardiology [11, 12].
We propose that the absence of the usual standing wave effect, which normally produces a greater systolic pressure in the leg than in the arm, is an effective method to predict vascular pathology in young CoA patients. This, in turn, can more effectively track their outcomes in between imaging studies and identify those in need of closer follow-up or intervention. To test this proposal, we correlated patients’ arm to leg BP gradients with their echocardiographic findings of aortic velocities and ventricular wall thickening. We present our results from a follow-up assessment of a series of patients with repaired CoA.
2. Methods
One hundred and ninety-nine patients were identified, who had a CoA repair (either isolated or with a ventricular septal defect) from 1990 to 2007, all performed by the same surgeon at our academic institution via the subclavian flap technique. Given the large, multistate referral base, 72 patients were followed elsewhere and excluded. Adequate follow-up required office visits with documented height, weight, and right arm and leg blood pressures along with a reviewable echocardiogram. Among the patients followed at our institution, 46 did not have all clinical information available – either no follow-up echocardiogram in our system or lack of an office leg blood pressure recording – and were excluded. This left 81 patients for detailed analysis.
The resting supine arm-leg BP gradient, systolic BP in the right arm minus the systolic BP in the upper leg, was calculated for each patient. Undersized cuffs and patient agitation were avoided. If the patient had a negative or absent gradient (arm less than leg systolic BP, which is the expected finding under normal physiology) they were placed in Group 1; if the gradient was abnormally positive (arm greater than leg) they were assigned to Group 2 [13]. The right arm systolic and diastolic BPs were indexed according to Z-score, which is the number of standard deviations from the healthy population mean based on gender, age, and height [14]. A Z-score >2, approximately >95th percentile, was taken to indicate hypertension, as was the prescription of antihypertensive medications.
Echocardiograms were analysed for both Doppler and dimensional data. Doppler data were used to measure the largest peak velocity seen in the descending aorta (PeakV); substantial flow acceleration was identified when PeakV >2.5 m/s [4]. Mean descending aortic velocity (MeanV) was obtained from tracing of the entire systolic and diastolic flow to integrate and time average the maximum velocities throughout the cardiac cycle. The mean velocity in the proximal abdominal aorta was measured with the same method. The diameters of the proximal transverse arch (TA, using 2D in suprasternal view) and abdominal aorta (using 2D sagittal view) were also determined, along with the left ventricle posterior wall thickness during diastole (LVPWd, using M-mode). These were again indexed by the Z-score where >2 indicated hypertrophy [15].
Patients’ records were reviewed for re-intervention and the need for antihypertensive therapy.
Statistical Analysis
All analysis was performed with commercially available software. The Pearson coefficient determined the correlation between variables. Student’s t-test was used to find differences between normally distributed populations as determined by the Shapiro-Wilk test, and if non-parametric, a Mann-Whitney U test was employed. Fisher’s exact test was used to calculate the association between groups. Statistical significance was ascribed when the probability of p < 0.05 was reached.
3. Results
Of the 81 CoA patients that met our criteria, 52 (64%) were in Group 1 (median follow-up 12.5 years, age at CoA repair 15 days), and 29 (36%) were in Group 2 (median follow-up 12 years, age at repair 10 days). Demographic data were similar between the two groups, except that there was a higher overall arm systolic pressure in Group 2 along with a greater likelihood of requiring a previous balloon dilation of the CoA site (Table 1 & Figure 1). Interestingly, the rate of clinical hypertension did trend higher for Group 2 but was not statistically significant.
TABLE 1: Patient demographic and clinical data.
|
|
Group 1 (n = 52) |
Group 2 (n = 29) |
p-value |
|
Male |
40 (77%) |
21 (72%) |
0.8 |
|
Bicuspid valve |
30 (58%) |
15 (52%) |
0.6 |
|
Median years f/u |
12.5 years [3y – 34y] |
12 years [5y – 25y] |
0.1 |
|
Median age at surgery |
15 days [0d– 16y] |
10 days [2d– 7y] |
0.3 |
|
Systolic BP Z-score |
0.4 (1.1) |
1.1 (1.0) |
<0.01 |
|
Diastolic BP Z-score |
0.2 (0.9) |
0.3 (1.0) |
0.7 |
|
Hypertension* |
10 (19%) |
11 (38%) |
0.1 |
|
Balloon Dilation? |
3 (6%) |
7 (24%) |
0.03 |
Values are given as averages (standard deviation) unless specified. [] : range; f/u: follow-up; d: days; y: years; BP: Blood Pressure.
*Systolic blood pressure Z-score >2 or on anti-hypertensive medication.
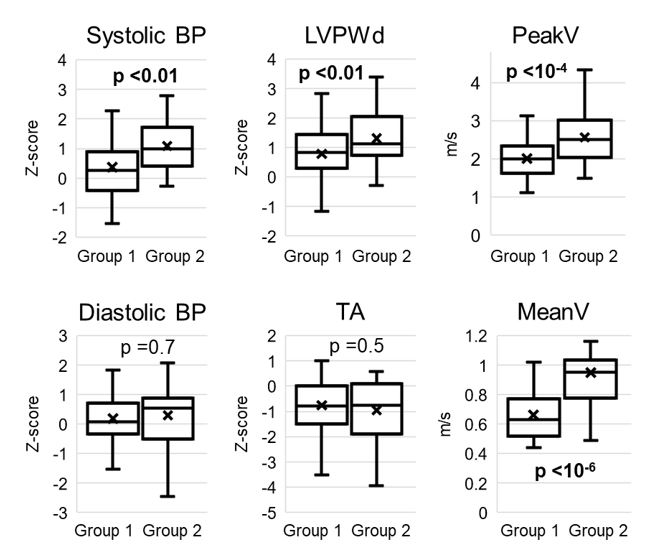
TABLE 2: Patient echocardiographic findings.
|
|
Group 1 |
Group 2 |
p-value |
|
LVPWd Z-score |
0.7 (1.2) |
1.4 (1.0) |
<0.01 |
|
TA Z-score |
-0.8 (1.1) |
-1.0 (1.2) |
0.5 |
|
PeakV (m/s) |
2.0 (0.5) |
2.6 (0.7) |
<10-4 |
|
MeanV (m/s) |
0.7 (0.2) |
1.0 (0.3) |
<10-6 |
|
Abd Ao Z-score |
-0.1 (1.1) |
-0.6 (1.4) |
0.2 |
|
Abd Ao MeanV (m/s) |
0.3 (0.1) |
0.4 (0.1) |
<0.01 |
Values are given as averages (standard deviation). LVPWd: Left Ventricular Posterior Wall Thickness During diastole; TA: Transverse Arch; PeakV: Peak Descending Aorta Velocity; MeanV: Mean Descending Aorta Velocity; Abd Ao: Abdominal Aorta.
Looking at the echocardiographic data, there was a highly significant increase in PeakV and MeanV in Group 2 compared to Group 1, along with significantly increased left ventricular wall size (average 75th percentile vs. 90th percentile) (Table 2 & Figure 1). There was a small but significant difference between the abdominal aortic mean velocity between groups (there was no difference between abdominal peak velocities, data not shown). There was no difference in TA size or abdominal aortic diameter.
The relationship between a normal blood pressure gradient and the PeakV revealed a zero-order correlation; that is, when the blood pressure gradient was <0 mmHg (Group 1), as expected under ordinary circumstances, the PeakV was consistently between 1.5 and 2.5 m/s. This PeakV is slightly higher than predicted in a standard population but compatible with satisfactory CoA outcomes. However, as the blood pressure gradient became abnormal (>0 mmHg), the PeakV began to increase linearly with the gradient (r= 0.58, Figure 2).
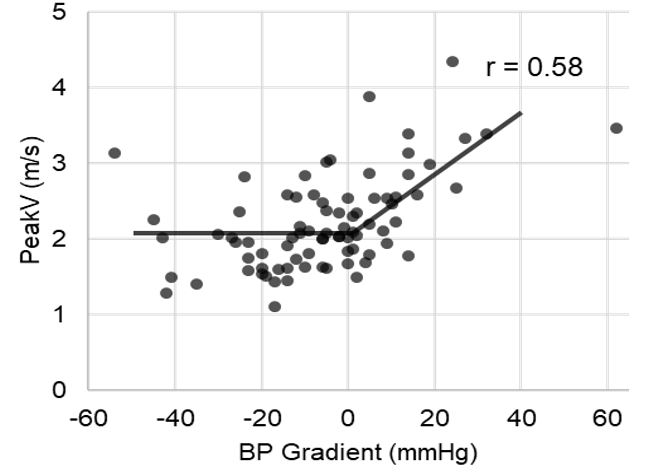
TABLE 3: Sensitivity, specificity, and negative predictive value of blood pressure gradient (Group 2) vs. clinical hypertension alone.
|
|
|
Group 2 |
Hypertension |
|
Specificity |
Flow Acceleration |
75% |
81% |
|
LVPWd Hypertrophy |
69% |
77% |
|
|
Sensitivity |
Flow Acceleration |
63% |
42% |
|
LVPWd Hypertrophy |
69% |
31% |
|
|
NPV |
Flow Acceleration |
83% |
74% |
|
LVPWd Hypertrophy |
92% |
84% |
NPV: Negative Predictive Value; LVPWd: Left Ventricular Posterior Wall Thickness During diastole.
Table 3 compares the sensitivities, specificities, and negative predictive values for using arm-leg BP gradients (Group 2) versus observed hypertension (n= 21/81 patients, 26%) to identify patients with echocardiographic abnormalities: PeakV >2.5 cm/s, LVPWd Z-score >2. Though the specificities were unsurprisingly similar, for the purposes of screening, the detection of a gradient was much more sensitive (63-69% vs. 31-42%); in other words, relying on a single blood pressure measurement alone will fail to capture over half of children with important underlying pathology.
Of those 21 patients meeting our definition of hypertension, there were 7 patients with measured hypertension in the clinic and another 14 patients on prescribed antihypertensive medications. Even when these hypertensive patients with known cardiovascular illness are excluded, Group 2 subjects who were otherwise clinically silent were still found to have the same statistically significant hemodynamic differences when compared to Group 1 subjects (aside from abdominal aortic mean velocity, Table 4).
TABLE 4: Comparing Group 1 vs. Group 2 for those without hypertension.
|
|
Group 1 (n= 41) |
Group 2 (n= 19) |
p-value |
|
SBP Z-score |
0.1 (0.8) |
0.8 (0.6) |
<0.01 |
|
DBP Z-score |
0.1 (0.9) |
0.2 (0.8) |
0.7 |
|
LVPWd Z-score |
0.7 (1.2) |
1.4 (0.9) |
0.03 |
|
TA Z-score |
-0.7 (1.1) |
-0.7 (0.9) |
0.9 |
|
Abd Ao Z-score |
0.1 (1.1) |
-0.3 (1.4) |
0.4 |
|
PeakV (m/s) |
2.0 (0.5) |
2.4 (0.6) |
0.02 |
|
MeanV (m/s) |
0.6 (0.2) |
0.9 (0.2) |
<10-4 |
|
MeanV Abd Ao (m/s) |
0.3 (0.1) |
0.4 (0.1) |
0.3 |
Values are given as averages (standard deviation). SBP: Systolic Blood Pressure; DBP: Diastolic Blood Pressure; LVPWd: Left Ventricular Posterior Wall Thickness During diastole; TA: Transverse Arch; Abd Ao: Abdominal Aorta; PeakV: Peak Descending Aorta Velocity; MeanV: Mean Descending Aorta Velocity.
4. Discussion
These results show that a comparison between a properly obtained systolic BP measured in the arm and in the leg can effectively identify CoA patients with increased arch velocities and ventricular wall thickness, findings most often only seen with echocardiogram or MRI. There is normally an increased systolic BP in the leg compared to the arm due to the standing wave effect; a deviation from this normal physiology, as is seen in Group 2 suggests an underlying pathology. The standing wave effect is a phenomenon in which a pressure wave deflection (from areas of bifurcation or resistance change) combines with an incoming forward wave to augment the observed pressure. These reflected waves cause more peripheral arteries, like those in the leg, to have higher systolic pressures than those in the more proximal arm arteries: the distal arteries observe a later forward pressure wave from the heart and a stronger more immediate reflected wave [13]. As we age, arteries harden, creating a more rapid pressure wave propagation with a larger, tighter overlap of the anterograde and retrograde wave, contributing to greater systolic BP augmentation both peripherally and centrally (this effect likely contributes to essential hypertension in the elderly) [16]. Similarly, in CoA patients, there is often a premature stiffening/loss of compliance of the arteries proximal to the site of the original coarctation, which leads to an increased standing wave effect and central pressure augmentation [5, 6, 9, 17]. An obstruction (i.e., restenosis) would cause a similar effect.
The strongest relationships between Groups 1 and 2 were found in the velocity of blood flow across the arch. Though this could be explained by either a hypoplastic arch or restenosis of the coarctation site, the fact that there was no recurrence or difference in arch size (p= 0.5) implies that the increased velocities are not a byproduct of geometric narrowing. Instead, vascular stiffening is a likely cause. The lack of wall movement directs more energy towards kinetics/blood flow, resulting in faster flow and consequently, greater pressure head losses in the lower extremities (the Darcy-Weisbach phenomenon), contributing to the pressure difference in Group 2 [18]. Indeed, recent studies using protocolized cardiovascular MRI have suggested that stiffness at the site of coarctation repair in some patients generates more intense reflected pressure waves leading to increased central blood pressure and ventricular mass [17]. The fact that Group 2 was more likely to have experienced balloon dilation of the CoA site supports this finding. The increased ventricular wall thickness seen in Group 2 is suggestive not only of increased systolic BP but more importantly, increased central blood pressure [19]. This again, is likely a consequence of arterial stiffness [13, 16, 17], and is often seen even before systemic hypertension is clinically apparent [20, 21]. The arterial stiffening creates an increased pulse wave velocity, which causes the standing wave to return the heart earlier and increase afterload instead of returning during late diastole when it would normally aide in coronary perfusion.
The coronary arteries are significantly affected in CoA, with intimal thickening and atherosclerotic changes seen in adolescence along with a larger lumen to compensate for increased metabolic demand [22]. Even without apparent obstructive coronary artery disease, patients with successfully repaired CoA have been found with significantly reduced perfusion reserve at a young age due to arterial stiffness limiting diastolic flow [23]. Given that CoA patients have early histological evidence of coronary atherosclerotic changes and intrinsically impaired perfusion capabilities, combined with thick ventricular walls and increased metabolic demand, it is not surprising that myocardial infarction and heart failure are classically the most common cause of early death following surgery responsible for 37-46% of premature deaths in initial series, usually before the age of 40 [1, 2]. Therefore, it is critical to have appropriate screening mechanisms in place to better identify those with these ventriculo-aortic functional disturbances [24, 25].
Guidelines are not specific and only suggest measuring an arm-leg BP gradient if clinical concerns, such as systemic hypertension, are present, usually in a search for restenosis with a BP gradient > 20 mmHg [4, 7]. However, we found that the presence of an arm-leg BP gradient is not only useful for restenosis but can strongly predict increased arch blood velocity and ventricular thickness. The relationships hold true even when a patient is clinically silent with no systemic hypertension, suggesting an expanded and more protocolized role for routine arm-leg BP measurements in the clinic. Detecting pathology when hemodynamics seems otherwise normal is especially significant to the CoA population, who often have normal office blood pressures but then are found to be vasculopathic [8, 9], or hypertensive with exercise and 24-hour monitoring [3, 4, 10]. Even though a patient may ostensibly appear healthy, there could be the underlying functional deficits that put the patient at risk.
It is important for the clinician to be able to recognize and screen for these patients, which can be difficult and inconsistent: by our data, hypertension alone misses over half, and exercise testing remains under debate and difficult to perform [10, 25]. We found that having a positive arm-leg blood pressure gradient identifies 63% and 69% of patients with elevated arch velocity and ventricular hypertrophy, respectively, with a negative predictive value between 80-90%. While not perfect, this is similar to other screening methods employed, such as ST changes during exercise to detect coronary disease [26]. Perhaps most importantly, the gradient is quite easy to measure by the cardiologist or primary physician, and frequent assessment can be a valuable guide to who may need additional/shorter interval imaging or therapeutic intervention.
This report is not without limitations. First, a large cohort of patients had to be excluded due to geographic constraints and unavailable retrospective data. The patients also represent a broad age range, and results do not track how the gradient or echocardiographic data changes with time. These data are also from a single institution, from a single surgeon using an operation (subclavian flap repair) that has fallen out of favor in many centers, bringing its broad applicability into question.
5. Conclusion
CoA is a congenital defect with lifelong consequences and therefore requires lifelong follow-up and monitoring. As survival improves, the period of continuous patient observation has expanded to the order of decades. An acceptable way of monitoring aside from echocardiography or cardiac MRI should be explored to better track patients in between imaging studies and prevent increased strain on health care availability/costs. The arm-leg BP gradient accurately identifies patients with relieved CoA who have increased arch blood flow velocities and ventricular wall thickness, at least in the pediatric-adolescent post CoA repair subjects for whom we have developed data. When applied to the practice setting, a frequent check of the arm-leg BP gradient can supplement the more expensive and involved echocardiogram or cardiac MRI to serve as a reasonable, effective method for CoA follow-up by identifying those with satisfactory outcomes and those in need of closer, more detailed observation.
Conflicts of Interest
None.
REFERENCES
- Cohen M, Fuster V, Steele PM, et al. “Coarctation of the aorta: Long-term follow-up and prediction of outcome after surgical correction.” Circulation, vol. 80, no. 4, pp. 840-845, 1989. View at: Publisher Site | PubMed
- Clarkson PM, Nicholson MR, Barratt Boyes BG, et al. “Results after repair of coarctation of the aorta beyond infancy: a 10 to 28 year follow-up with particular reference to late systemic hypertension.” Am J Cardiol, vol. 51, no. 9, pp. 1481-1488, 1983. View at: Publisher Site | PubMed
- O'sullivan JJ, Derrick G, Darnell R “Prevalence of hypertension in children after early repair of coarctation of the aorta: a cohort study using casual and 24 hour blood pressure measurement.” Heart, vol. 88, no. 2, pp. 163-166, 2002. View at: Publisher Site | PubMed
- Hager A, Kanz S, Kaemmerer H, et al. “Coarctation Long-term Assessment (COALA): significance of arterial hypertension in a cohort of 404 patients up to 27 years after surgical repair of isolated coarctation of the aorta, even in the absence of restenosis and prosthetic material.” J Thorac Cardiovasc Surg, vol. 134, no. 3, pp. 738-745, 2007. View at: Publisher Site | PubMed
- Xu J, Shiota T, Omoto R, et al. “Intravascular ultrasound assessment of regional aortic wall stiffness, distensibility, and compliance in patients with coarctation of the aorta.” Am Heart J, vol. 134, no. 1, pp 93-98, 1997. View at: Publisher Site | PubMed
- Ou P, Celermajer DS, Jolivet O, et al. “Increased central aortic stiffness and left ventricular mass in normotensive young subjects after successful coarctation repair.” Am Heart J, vol. 155, no. 1, pp. 187-193, 2008. View at: Publisher Site | PubMed
- Warnes CA, Williams RG, Bashore TM, et al. “ACC/AHA 2008 Guidelines for the Management of Adults with Congenital Heart Disease: Executive Summary: a report of the American College of Cardiology/American Heart Association Task Force on Practice Guidelines (writing committee to develop guidelines for the management of adults with congenital heart disease).” Circulation, vol. 118, no. 23, pp. 2395-2451, 2008. View at: Publisher Site | PubMed
- Swan L, Kraidly M, Vondermuhll I, et al. “Surveillance of cardiovascular risk in the normotensive patient with repaired aortic coarctation.” Int J Cardiol, vol. 139, no. 3, pp. 283-288, 2010. View at: Publisher Site | PubMed
- Trojnarska O, Szczepaniak Chicheł L, Mizia Stec K, et al. “Vascular remodeling in adults after coarctation repair: impact of descending aorta stenosis and age at surgery,” Clin Res Cardiol, vol.100, no. 5, pp. 447-455, 2011. View at: Publisher Site | PubMed
- Correia AS, Gonçalves A, Paiva M, et al. “Long-term follow-up after aortic coarctation repair: the unsolved issue of exercise-induced hypertension.” Rev Port Cardiol, vol. 32, no. 11, pp. 879-883, 2013. View at: Publisher Site | PubMed
- Allen HD, Shaddy RE, Penny DJ, et al. “Moss & Adams Heart Disease in Infants, Children, and Adolescents: Including the Fetus and Young Adult.” Wolters Kluwer Health/Lippincott /Williams & Wilkins, 2013.
- Moller J, Johnson W “Pediatric Cardiology: The Essential Pocket Guide, 2nd Edition.” John Wiley & Sons, 2008.
- Safar ME, Blacher J, Jankowski P “Arterial stiffness, pulse pressure, and cardiovascular disease-is it possible to break the vicious circle?” Atherosclerosis, vol. 218, no. 2, pp. 263-271, 2011. View at: Publisher Site | PubMed
- National High Blood Pressure Education Program Working Group on High Blood Pressure in Children and Adolescents “The fourth report on the diagnosis, evaluation, and treatment of high blood pressure in children and adolescents,” Pediatrics, vol. 114, no. 2, pp. 555-576, 2004. View at: PubMed
- Pettersen MD, Du W, Skeens ME, et al. “Regression equations for calculation of z scores of cardiac structures in a large cohort of healthy infants, children, and adolescents: an echocardiographic study.” J Am Soc Echocardiogr, vol. 21, no. 8, pp. 922-934, 2008. View at: Publisher Site | PubMed
- Avolio AP, Van bortel LM, Boutouyrie P, et al. “Role of pulse pressure amplification in arterial hypertension: experts' opinion and review of the data.” Hypertension, vol. 54, no. 2, pp. 375-383, 2009. View at: Publisher Site | PubMed
- Quail MA, Short R, Pandya B, et al. “Abnormal Wave Reflections and Left Ventricular Hypertrophy Late After Coarctation of the Aorta Repair.” Hypertension, vol. 69, no. 3, pp. 501-509, 2017. View at: Publisher Site | PubMed
- Tan Y, Tseng P, Wang D, et al. “Stiffening-induced high pulsatility flow activates endothelial inflammation via a TLR2/NF-κB pathway.” PLoS One, vol. 9, no. 7, pp. e102195, 2014. View at: Publisher Site | PubMed
- Roman MJ, Devereux RB “Association of central and peripheral blood pressures with intermediate cardiovascular phenotypes.” Hypertension, vol. 63, no. 6, pp. 1148-1153, 2014. View at: Publisher Site | PubMed
- Levy D “Left ventricular hypertrophy: Epidemiological insights from the Framingham Heart Study.” Drugs, vol. 35, no. 5, pp. 1-5, 1988. View at: Publisher Site | PubMed
- Post WS, Larson MG, Levy D “Impact of left ventricular structure on the incidence of hypertension: The Framingham Heart Study.” Circulation, vol. 90, no. 1, pp. 179-185, 1994. View at: Publisher Site | PubMed
- Vlodaver Z, Neufeld HN “The coronary arteries in coarctation of the aorta.” Circulation, vol. 37, no. 3, pp. 449-454, 1968. View at: Publisher Site | PubMed
- Cook SC, Ferketich AK, Raman SV “Myocardial ischemia in asymptomatic adults with repaired aortic coarctation.” Int J Cardiol, vol. 133, no. 1, pp. 95-101, 2009. View at: Publisher Site | PubMed
- Lam Y, Henein MY “Screening for ventriculo-aortic functional disturbances in patients with apparently successful repaired coarctation of aorta.” Int J Cardiol, vol. 145, no. 1, pp. 78-79, 2010. View at: Publisher Site | PubMed
- Swan L, Goyal S, Hsia C, et al. “Exercise systolic blood pressures are of questionable value in the assessment of the adult with a previous coarctation repair.” Heart, vol. 89, no. 2, pp. 189-192, 2003. View at: Publisher Site | PubMed
- Gianrossi R, Detrano R, Mulvihill D, et al. “Exercise-induced ST depression in the diagnosis of coronary artery disease: A meta-analysis.” Circulation, vol. 80, no. 1, pp. 87-98, 1989. View at: Publisher Site | PubMed